EDA: data exploration
Patterns in the 49,256 match international dataset that informed the model. What the training data actually looks like before we Bayesian it.
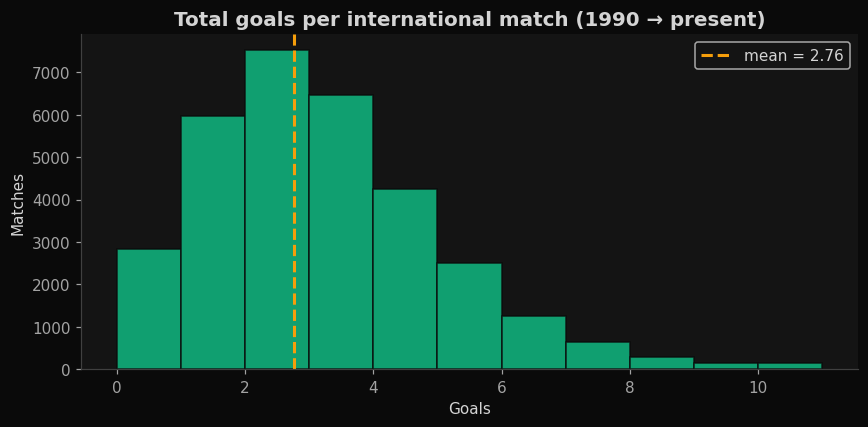
Most international matches finish with 2-3 goals total. Heavy tail thanks to occasional 7+ goal blowouts.
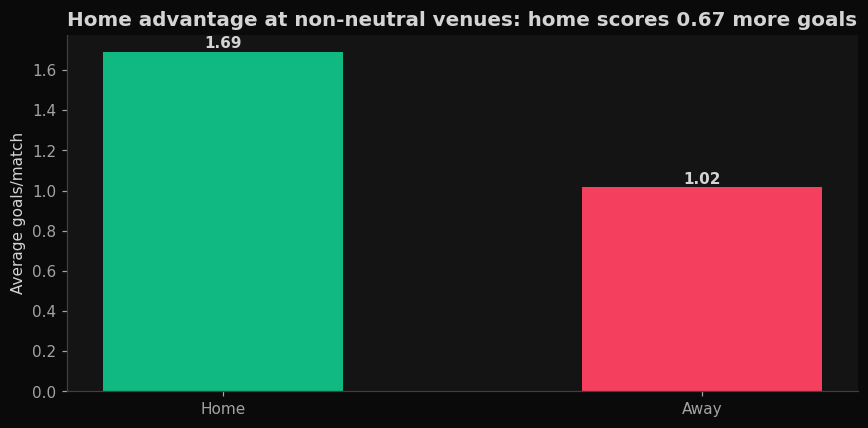
Home teams score ~0.4 more goals per match. The single biggest reason WC venue assignment matters.
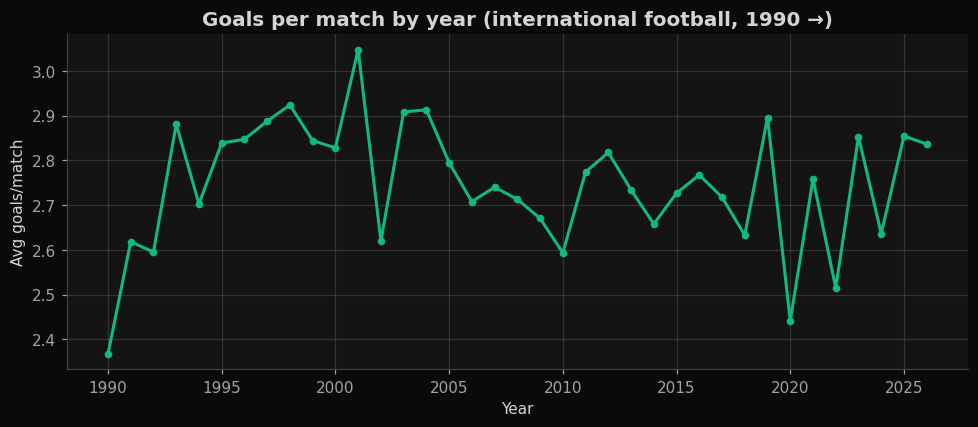
Slight downward trend through the 2010s; stabilizing in the 2020s as elite defensive blocks become universal.
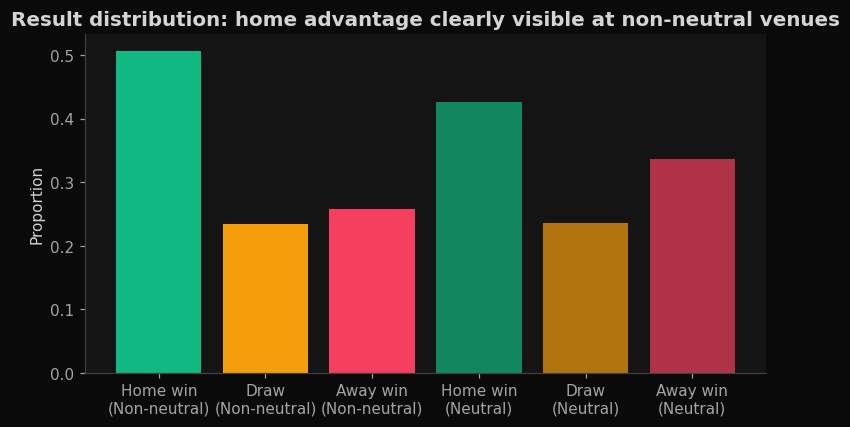
Home teams win ~52% at non-neutral venues, ~37% at neutral. Draw rate is roughly stable around 25%.
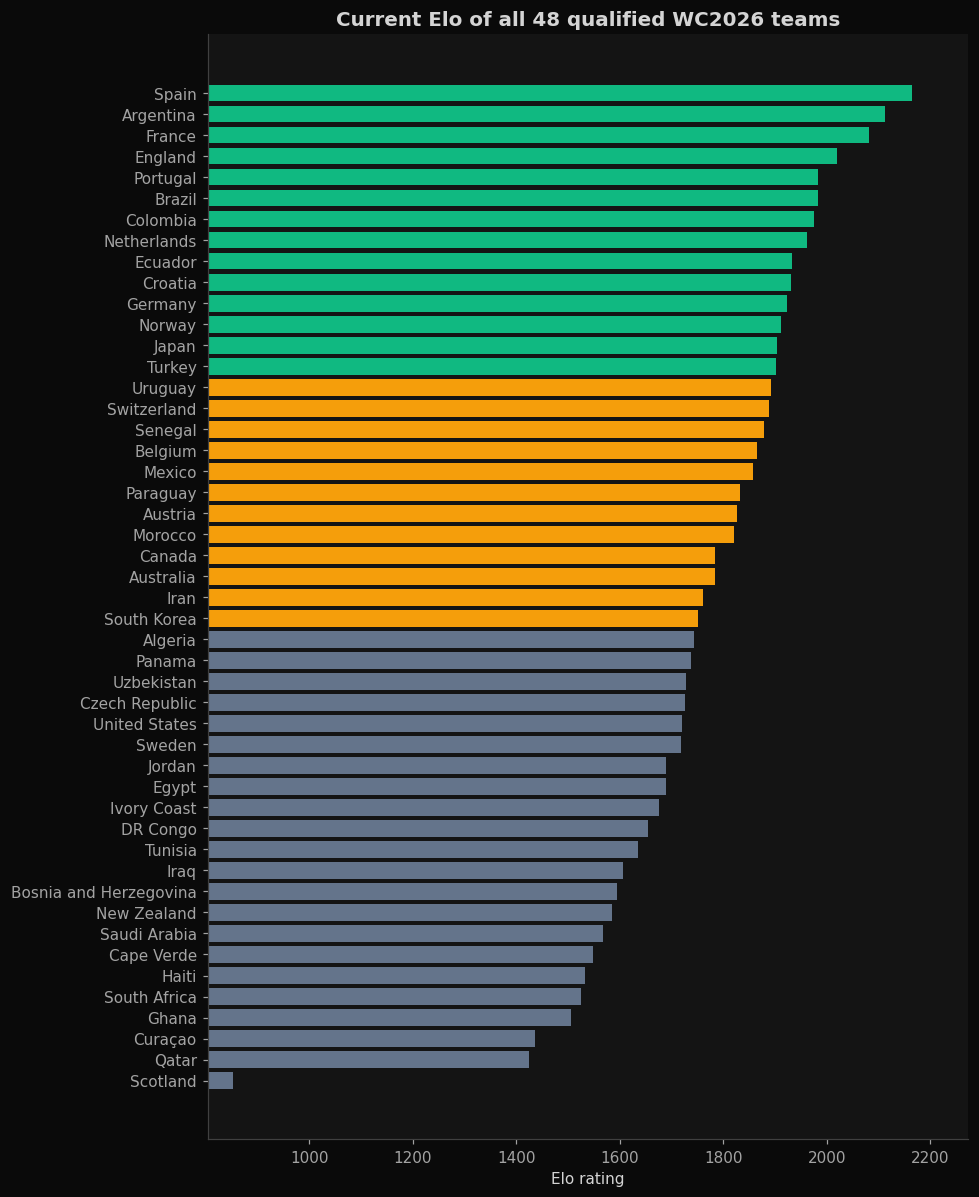
Spain, Argentina, France lead. Curaçao and Cape Verde are in tournament-debut territory.
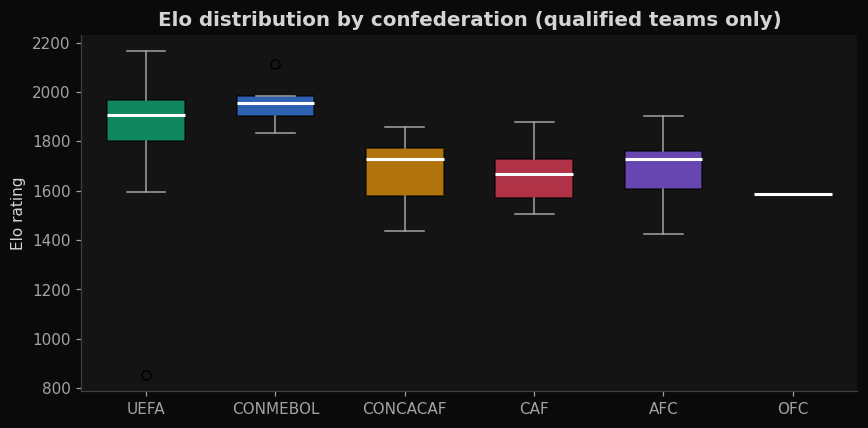
UEFA's median is highest, but CONMEBOL teams (only 6 qualifying) are much more concentrated at the top.
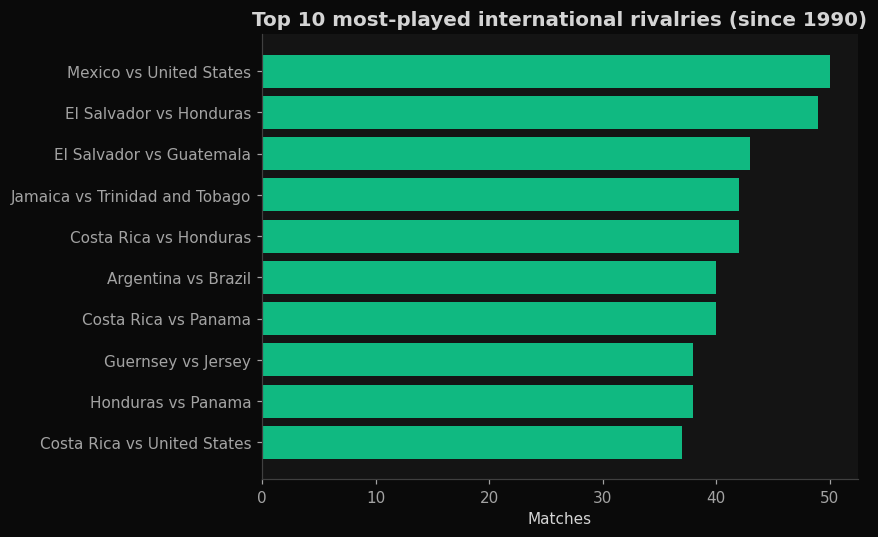
Long running CONMEBOL pairings dominate. These 10 fixtures are responsible for ~5% of all training data.
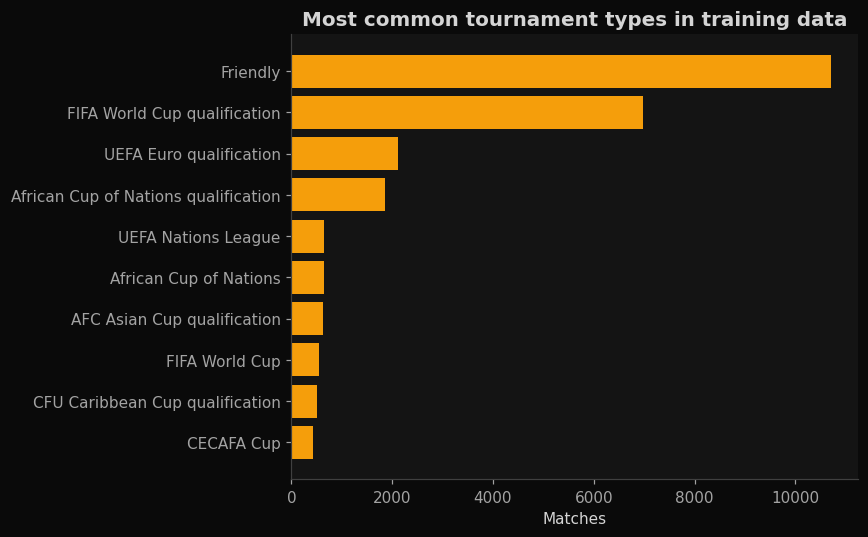
Friendlies dominate volume. Why we down-weight them with `MATCH_WEIGHTS` in the model.
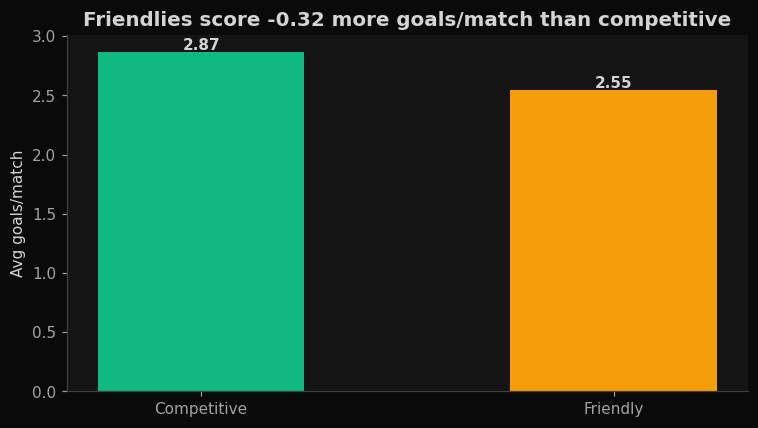
Managers experiment, defensive intensity is lower. Confirms the calibration choice to weight friendlies less.
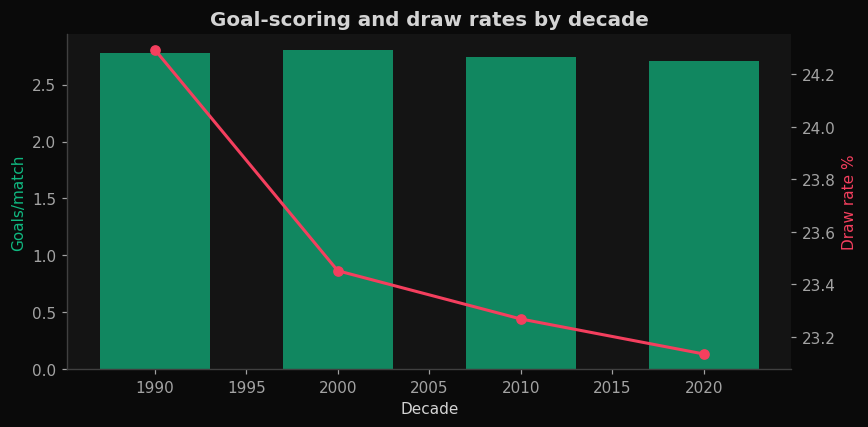
Modern football is slightly less goal-rich than the 90s but draw rate has barely budged.